Upcoming webinar on matched series

[Update 23/04/2015 – A recording of this webinar as well as the slides are now available online.]

Next Tuesday (14 April) I’ll be presenting a webinar entitled “Beyond Matched Pairs: Applying Matsy to predict new optimisation strategies”. The webinar will be hosted by our collaborators at Optibrium who have incorporated the Matsy algorithm into StarDrop (see earlier post). Here’s the abstract:
webinar_nextmove

Join our webinar with Noel O’Boyle of NextMove Software to learn how matched series analysis can predict new chemical substitutions that are most likely to improve target activity for your projects.

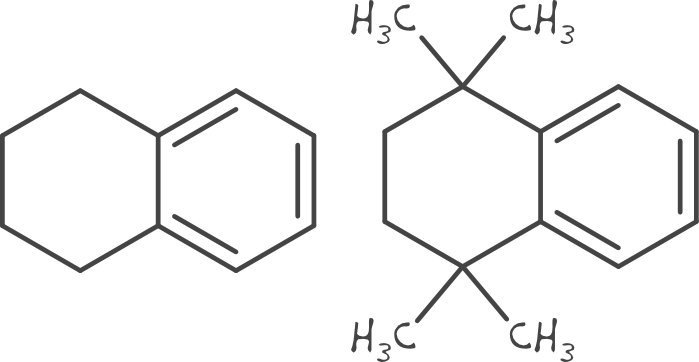
The Matsy™ algorithm for matched molecular series analysis grew out of a collaboration with computational chemists at AstraZeneca with the goal of supporting lead optimisation projects. Specifically, it was designed to answer the question, “What compound should I make next?”.

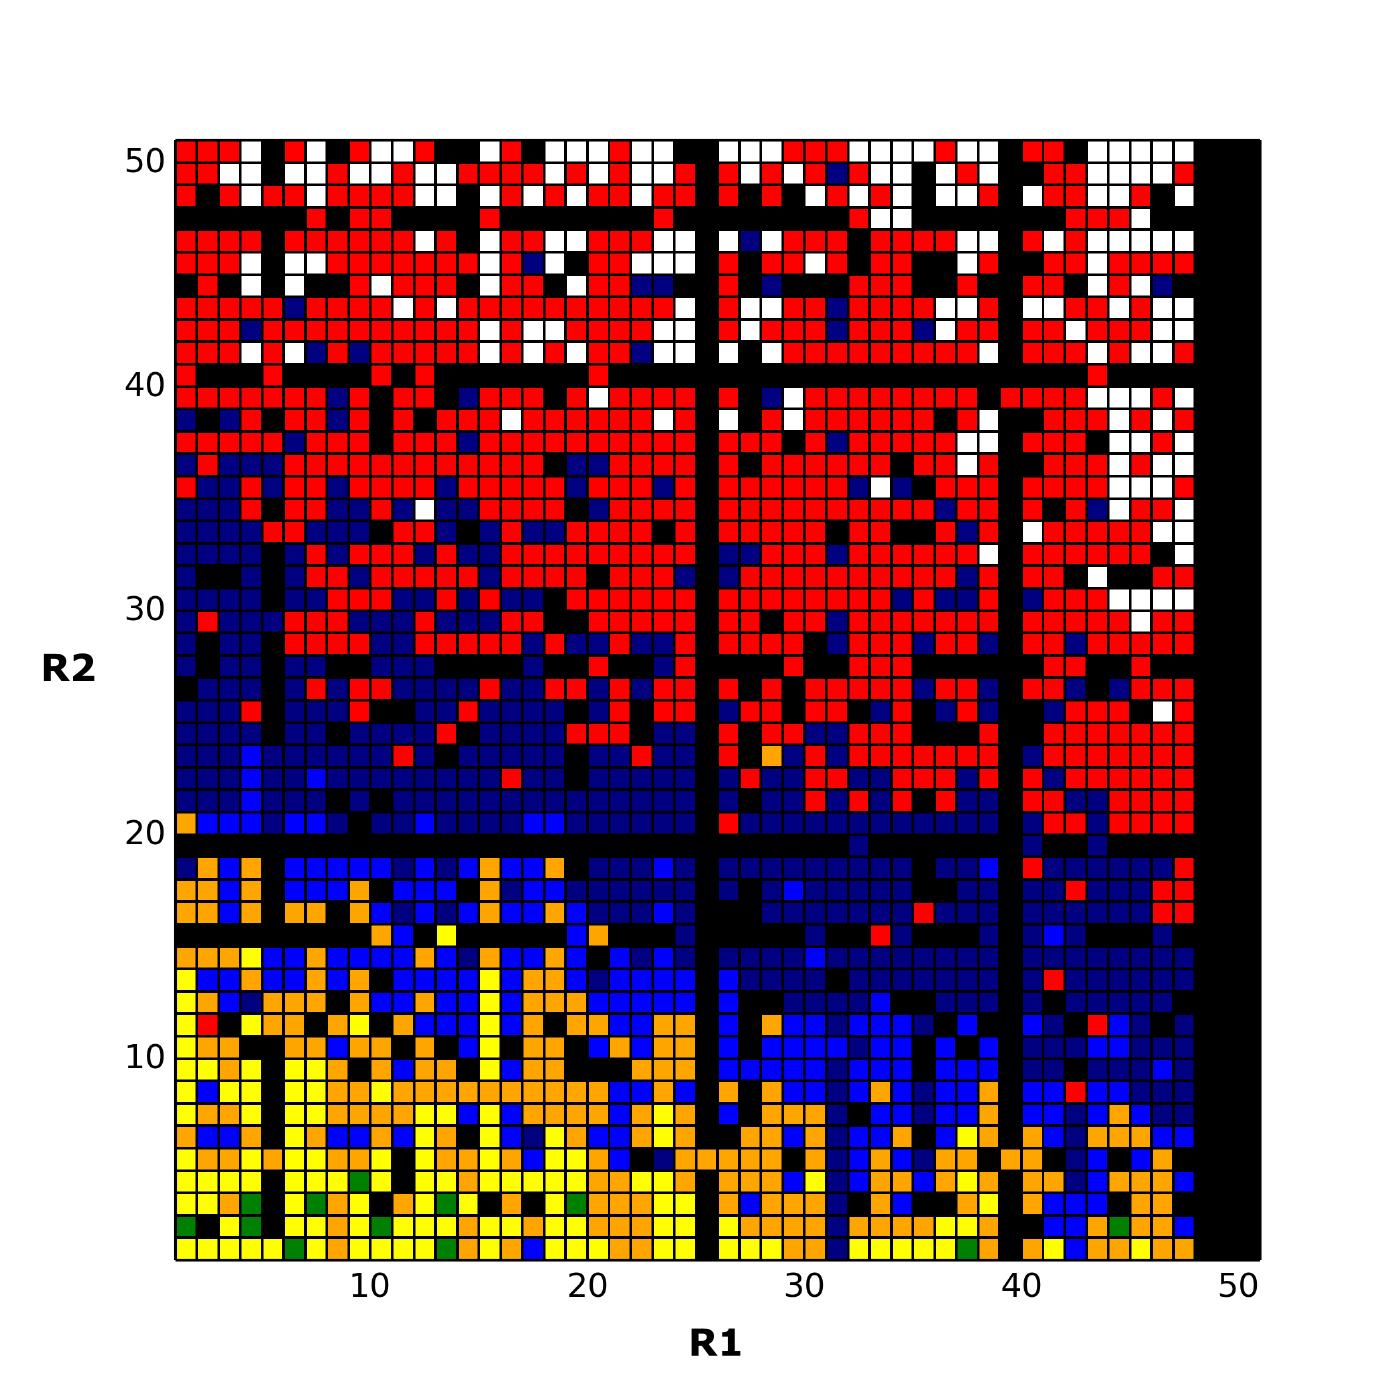
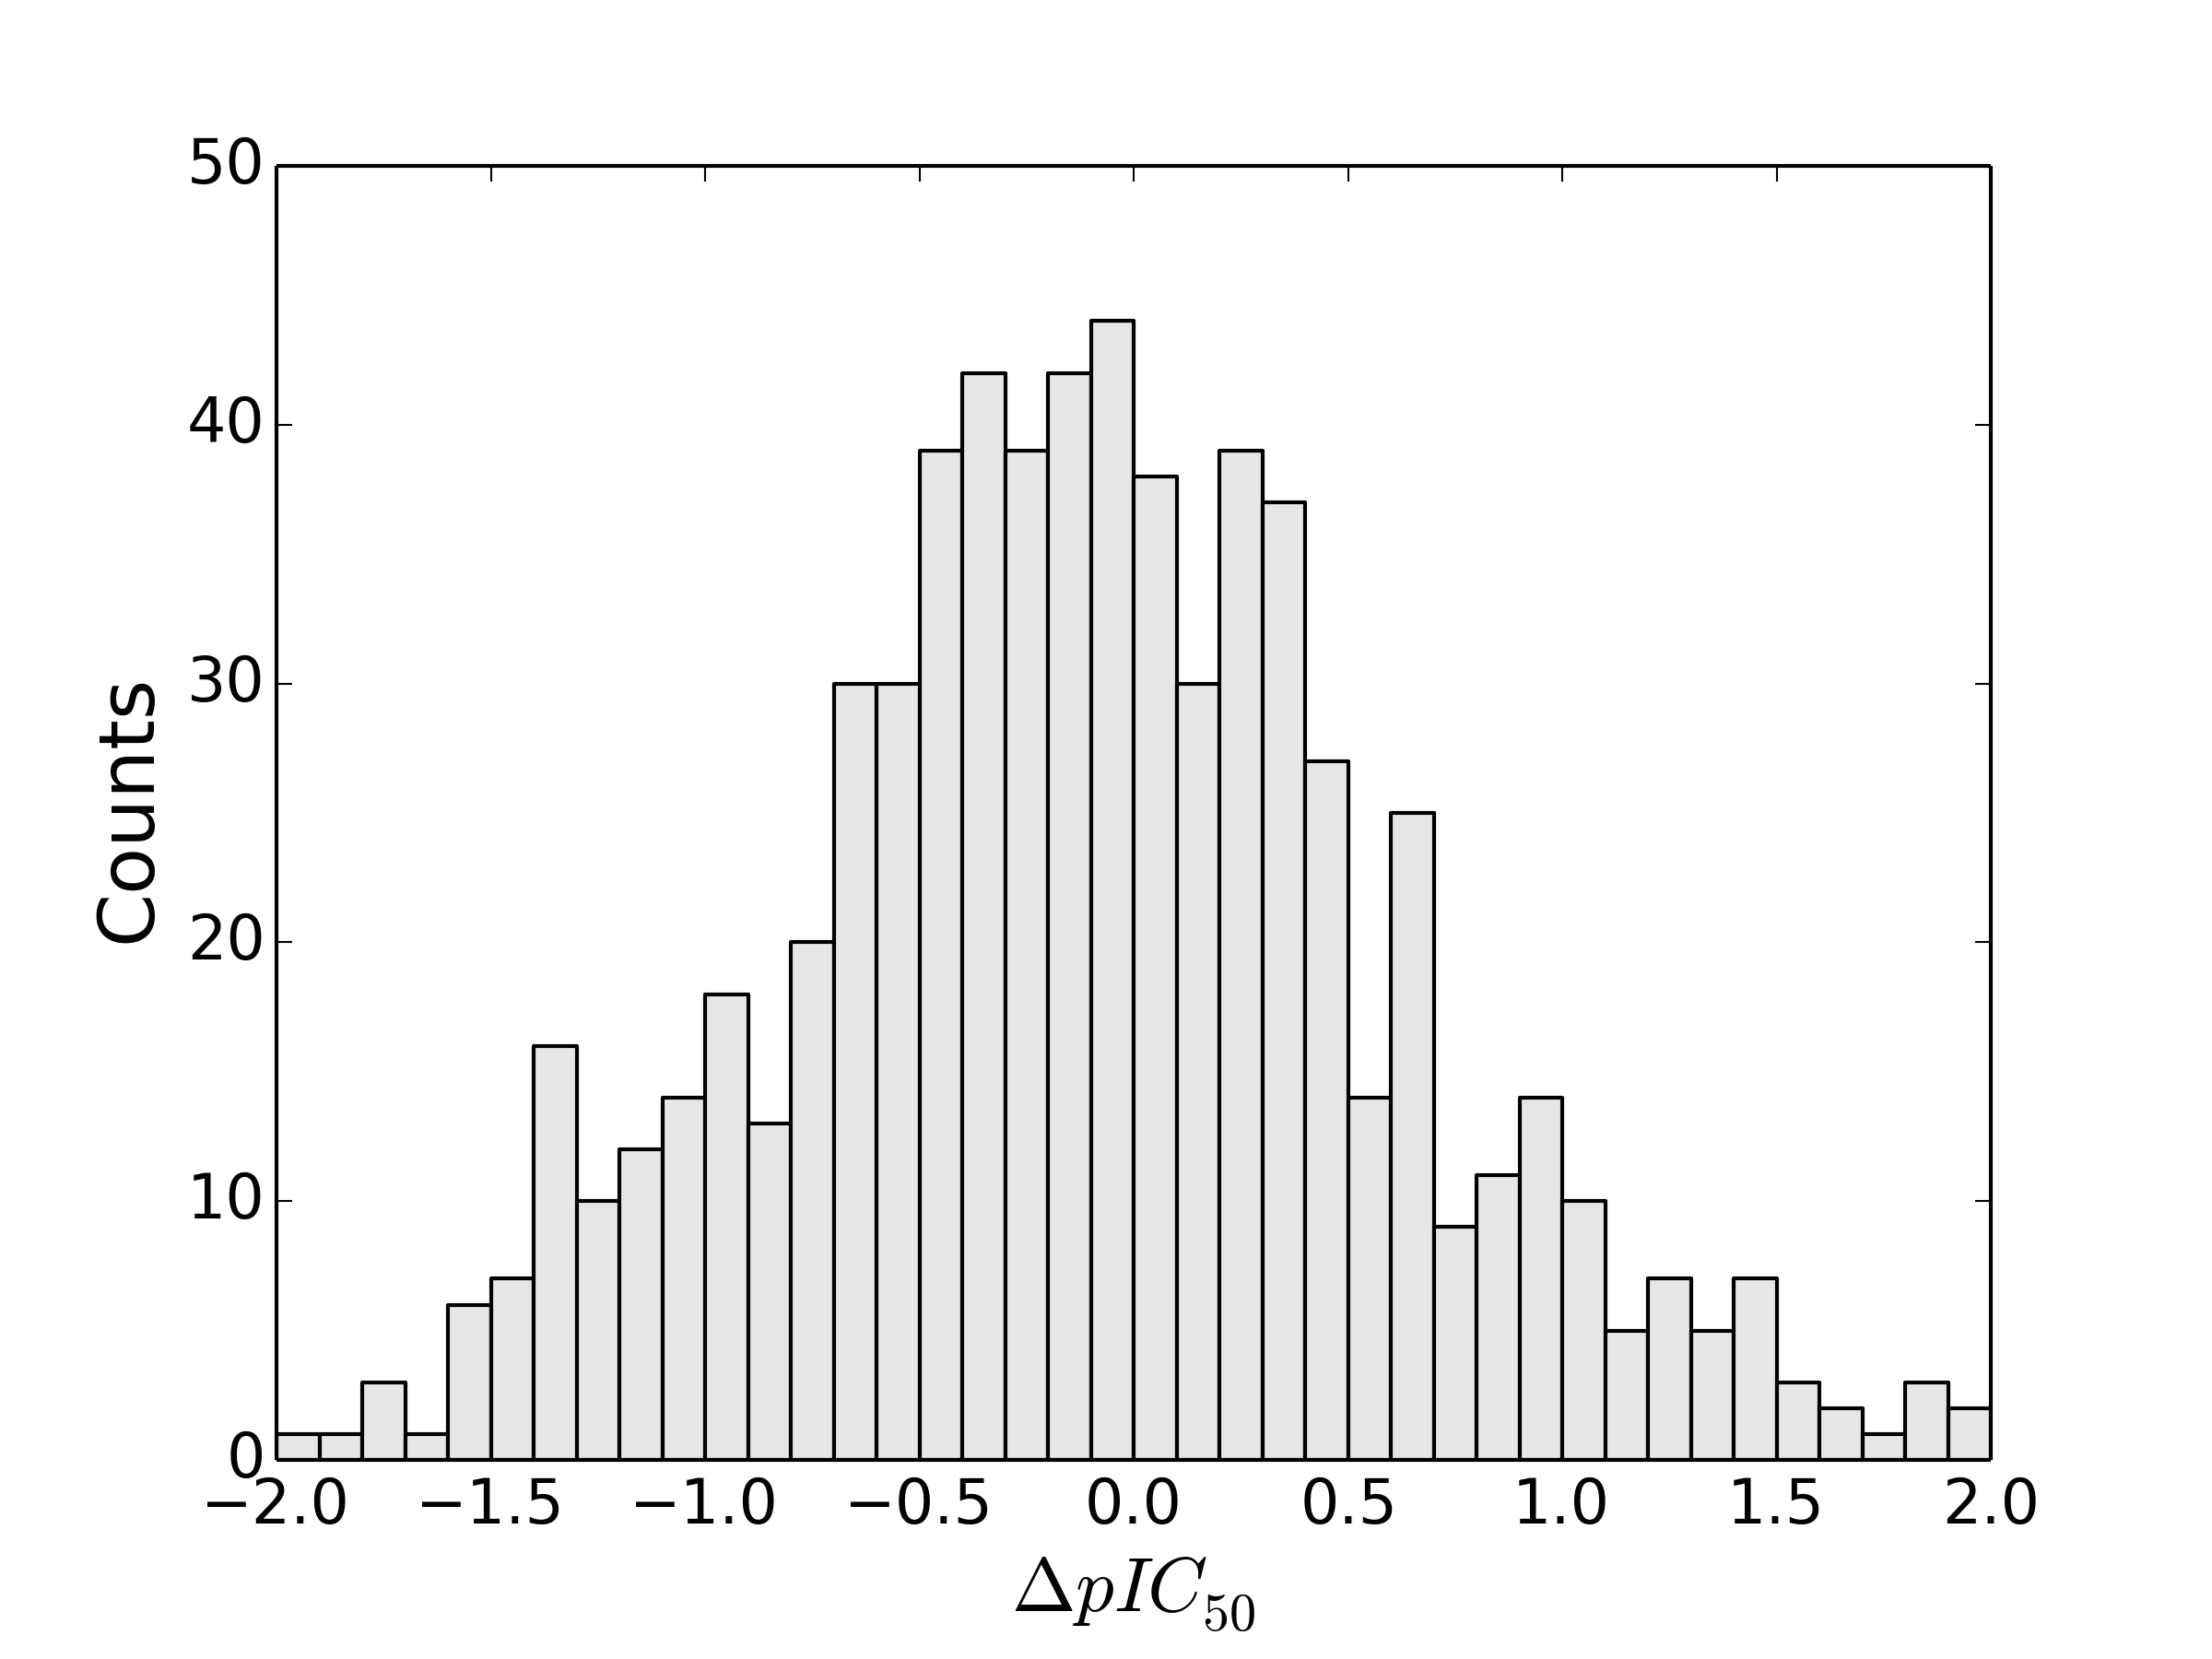
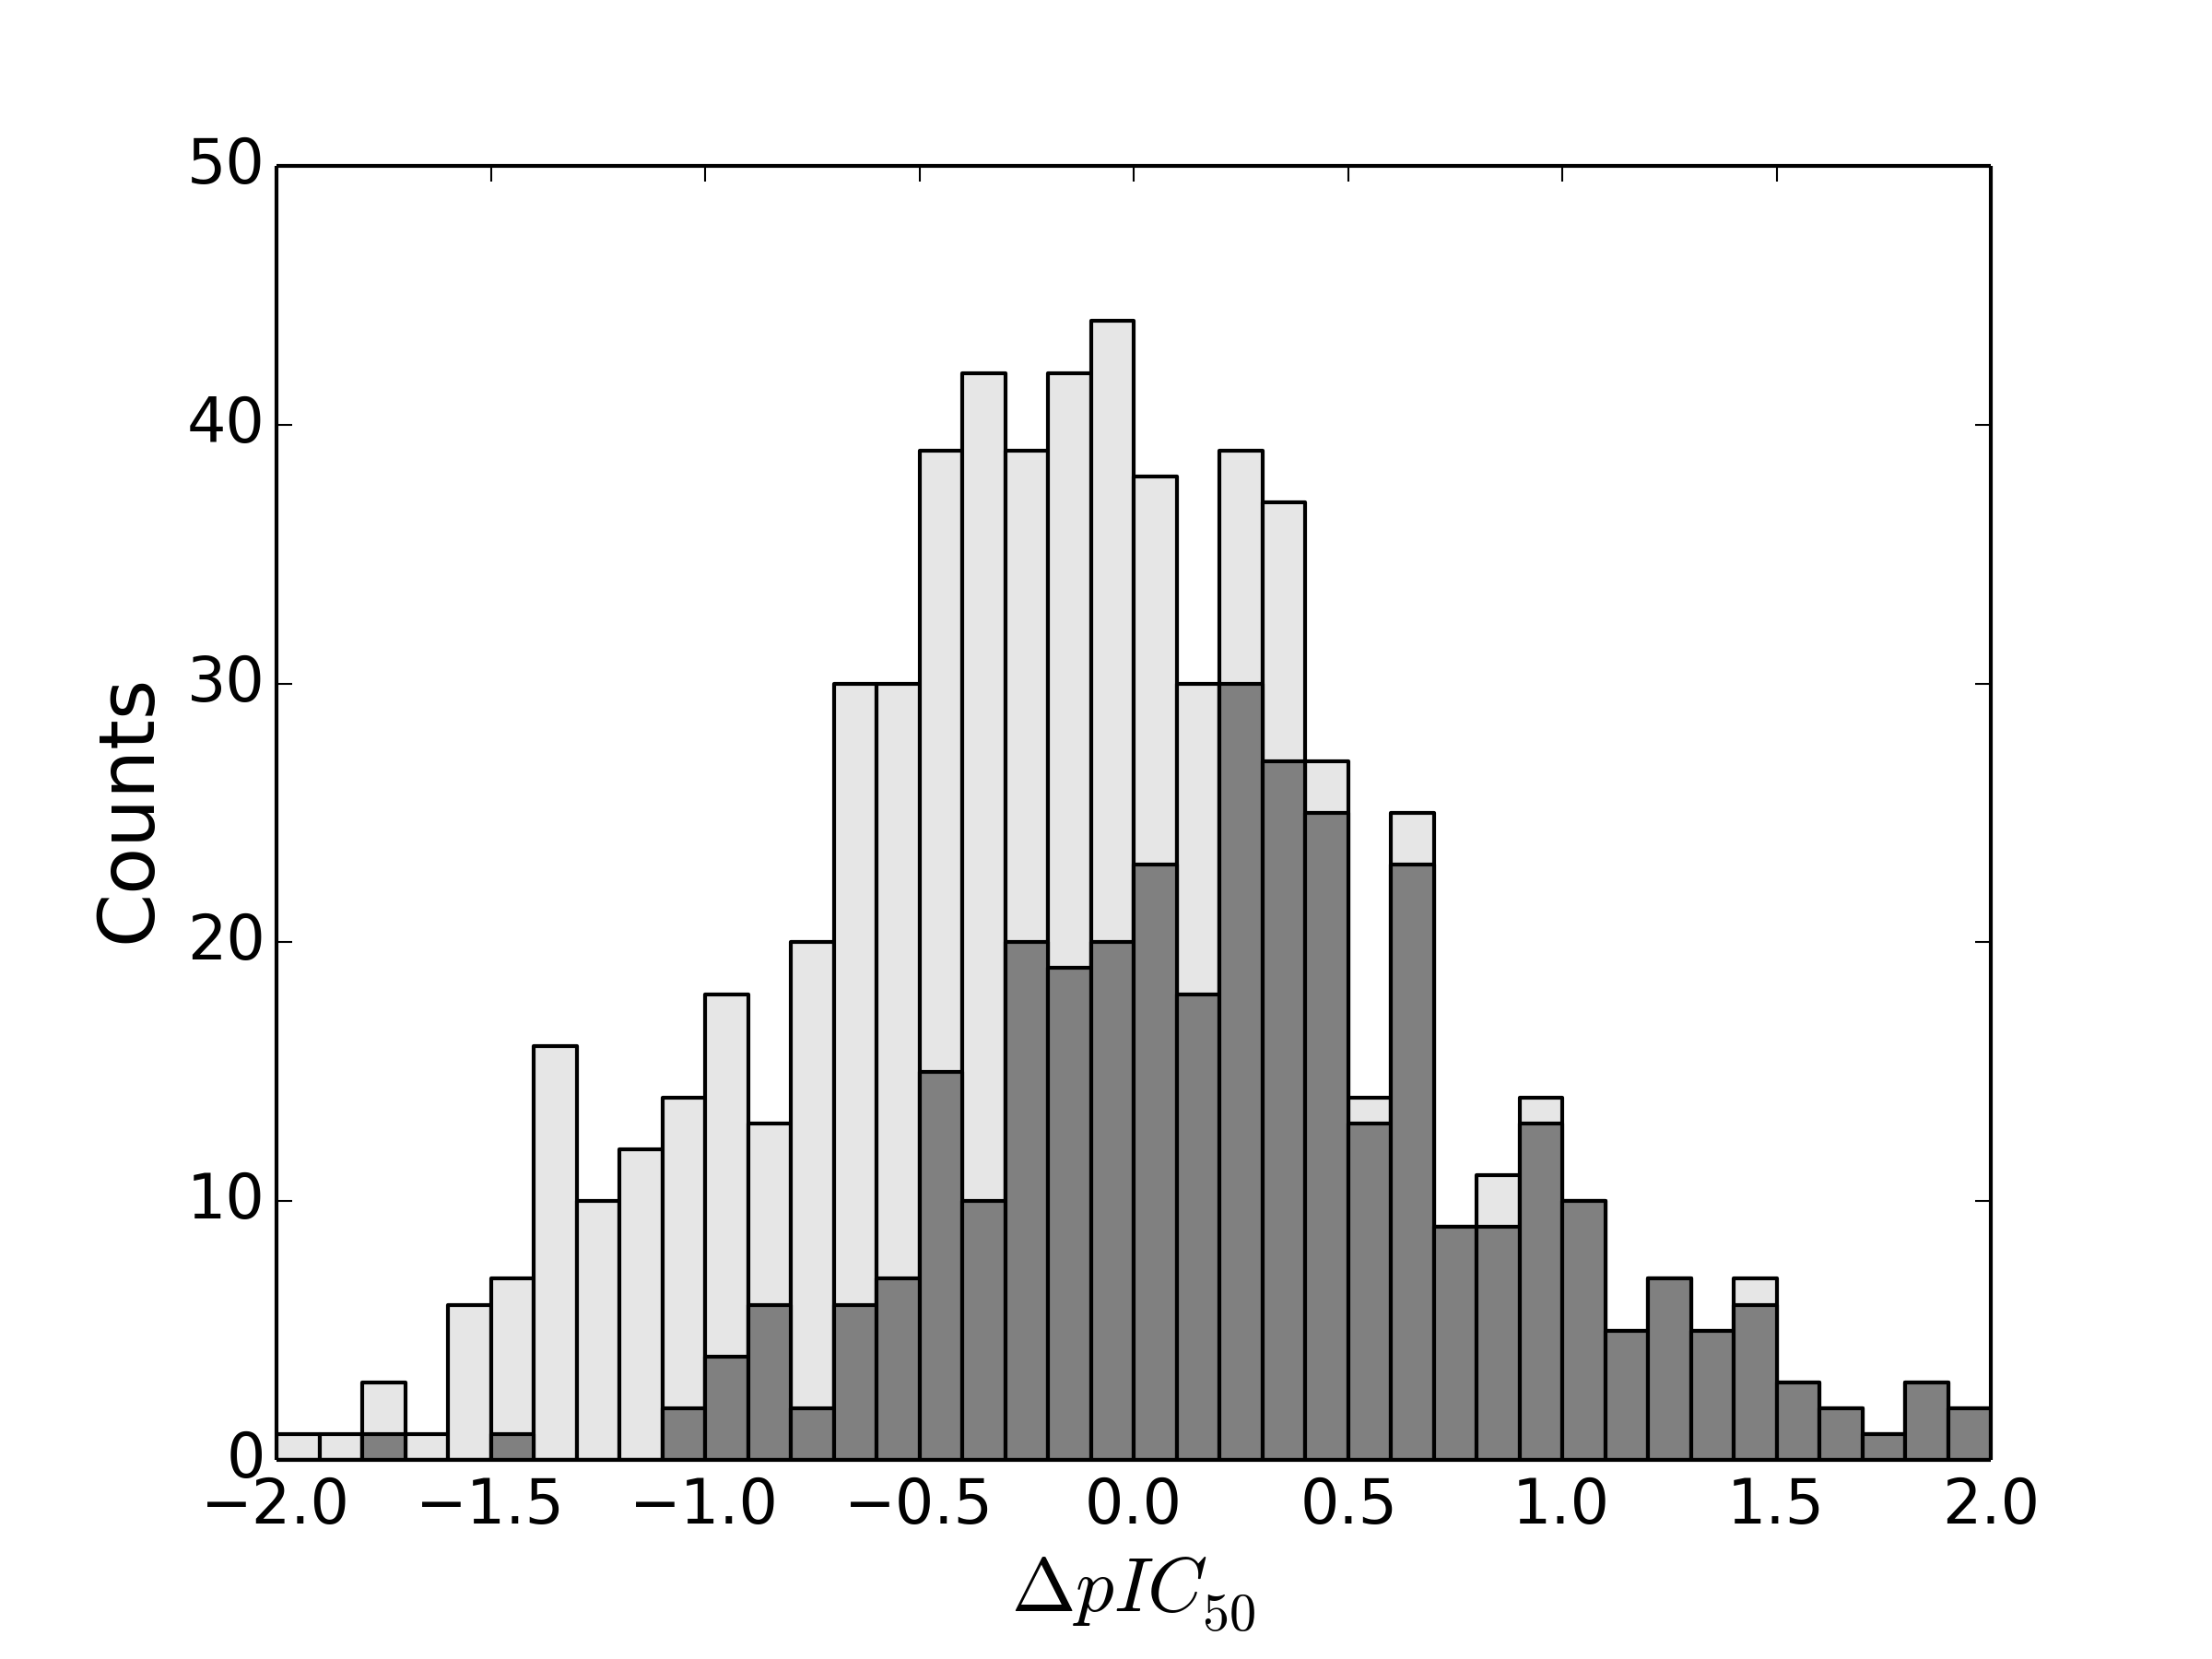
Matsy has been developed to generate and search in-house or public domain databases of matched molecular series to identify chemical substitutions that are most likely to improve target activity (J. Med. Chem., 2014, 57(6), pp 2704–2713). This goes beyond conventional ‘matched molecular pair analysis’ by using data from longer series of matched compounds (and not just pairs) to make more relevant predictions for a particular chemical series of interest. In addition, all predictions are backed by experimental results which can be viewed and assessed by the medicinal chemist when considering the predictions.

Matsy is applied in StarDrop’s Nova™ module, which automatically generates new compound structures to stimulate the search for optimisation strategies related to initial hit or lead compounds. StarDrop’s unique capabilities for multi-parameter optimisation and predictive modelling will enable efficient prioritisation of the resulting ideas to identify high quality compounds with the best chance of success.

I’ll be focusing on the science behind the algorithm itself rather than the specifics of its integration into StarDrop, so even if you’re not currently an Optibrium customer you may find this of interest.

To register, click on the image above or just here.

Enabling Machines to Read the Chemical Literature (ACS Session)

I am organizing a session at the August ACS meeting in Boston entitled:

Enabling Machines to Read the Chemical Literature: Techniques, Case Studies & Opportunities

Abstracts are still being accepted so if you’re interested I encourage you to submit. Topics covered by talks are likely to be quite varied e.g. extraction of chemistry from images, classification of extracted compounds, association of chemicals with metadata etc.

The session is in the CINF division and the deadline for submissions is the 29th March 2015. This is a hard deadline so if you’re interested in submitting please don’t miss it!

On the topic of ACS meetings, at the upcoming ACS meeting in Denver, Tony Williams will be presenting about the RSC’s work to collect NMR spectra. As co-authors of the presentation our contribution is in the form of text mining over a million NMR spectra and their associated compounds from patent filings.

Roger Sayle will be attending the Denver ACS if you want to catch up or discuss anything.

Session: CHED:NMR Spectroscopy in the Undergraduate Curriculum
Day/time: Sunday, March, 22, 2015 from 4:15 PM – 4:35 PM
Location: Gold – Sheraton Denver Downtown Hotel
Title: Providing access to a million NMR spectra via the web
Abstract: Access to large scale NMR collections of spectral data can be used for a number of purposes in terms of teaching spectroscopy to students. The data can be used for teaching purposes in lectures, as training data sets for spectral interpretation and structure elucidation, and to underpin educational resources such as the Royal Society of Chemistry’s SpectralGame (www.spectralgame.com). These resources have been available for a number of years but have been limited to rather small collections of spectral data and specifically only about 3000 spectra. In order to expand the data collection and provide richer resources for the community we have been gathering data from various laboratories and, as part of a research project, we have used text-mining approaches to extract spectral data from articles and patents in the form of textual strings and utilized algorithms to convert the data into spectral representations. While these spectra are reconstructions of text representations of the original spectral data we are investigating their value in terms of utilizing for the purpose of structure identification. This presentation will report on the processes of extracting structure-spectral pairs from text, approaches to performing automated spectral verification and our intention to assemble a spectral collection of a million NMR spectra and make them available online.

For every fingerprint optimisation, there is an equal and opposite fingerprint deterioration

FingerprintChemical fingerprints are used for both similarity and substructure searching. When used for similarity, a score accounts for features shared and different between compounds. For substructure searching, the fingerprint provides a prescreen of potential hits by enforcing that every feature encoded in the query fingerprint must be present in the reference. If a single feature is found in the query but not in the reference can it safely be discarded?

Common types of fingerprints include: substructure keys (MACCS, CACTVS), path (Daylight), circular (ECFP, Morgan), tree, and n-gram (LINGOS, IBM).  The fingerprint examples described below are often documented as being similarity fingerprints or “optimised for similarity” but it isn’t always stated that their use should be avoid for substructure screening. A fingerprint intended for similarity will often screen out results from a substructure search that do actually match (false negatives).

Connectivity

Circular and n-gram fingerprints inherently can not be used for substructure filtering as they capture the absence as well as the presence of neighbours [1].

fig-1

As is seen with the circular fingerprint, the number of neighbours (degree) is not invariant between the query and reference. The degree of the reference atoms must be equal or more to that of the query. The connectivity/degree can therefore not be encoded in the other types of fingerprints.

Hydrogen count

Similar to connectivity, the hydrogen count may be less than or greater than the query. The MACCS 166 substructure keys (as used in the open source toolkits) were reoptimised for similarity[2,3]. As some keys match hydrogen counts, they should not be used as a substructure fingerprint:

fig-2

In the compounds above, the MACCS keys 118 (‘[#6H2]([#6H2]*)*’>1) and 129 (‘[#6H2](~*~*~[#6H2]~*)~*’) are found in the query (left) but not the reference (right). The CACTVS substructure keys also match hydrogens (e.g. bit 329, 335) and have the same property. As with MACCS, the documentation states that the CACTVS keys are intended for similarity.

Hybridisation

Attempting to encode hybridisation is also problematic, consider the following query and target.

fig-3

The left is not considered a substructure of the right with the CDK’s hybridisiation fingerprinter as an sp2 carbon in the query is sp1 in the reference.

Rings

Care should also be taken with ring size, in particular the smallest ring size of an atom or bond is not invariant.

fig-4

This behaviour is observed with the CDK’s ShortestPath fingerprint where the query (left) has atoms in a smallest ring of size six but the reference (right) has atoms in either smaller ring of size five. More subtle issues are found when using the non-unique SSSR [4].  Some effects of the use of (E)SSSR are observed in the CACTVS substructure keys (intended for similarity as stated in the manual).

fig-5

For these two PubChem Compound entries (CID 135973, CID 9249) the query (left) encodes a four membered ring while the reference (right) does not.

It is possible to encode and match the degree and hydrogen count in a fingerprint just not as a single feature. Encoding the degree in the feature or layering properties (ala RDKit Fingerprint) can be done safely but is redundant and leads to a denser fingerprint. Ring size information can also be encoded, rather than encoding smallest rings, all ring sizes (up to some length) need to be encoded.

Take home message

Different fingerprints exist for different purposes and surprisingly few are truly suitable for substructure filtering. Path and tree fingerprints are generally okay but caution must be taken to ensure variant properties are not encoded. The keen eyed may notice there is no mentioned of issues with aromaticity in fingerprints; there are unfortunately too many to list in a single post.

  1. http://pubs.acs.org/doi/abs/10.1021/ci100050t
  2. http://pubs.acs.org/doi/abs/10.1021/ci010132r
  3. http://www.dalkescientific.com/writings/diary/archive/2011/01/20/implementing_cactvs_keys.html
  4. http://docs.eyesopen.com/toolkits/oechem/cplusplus/ring.html#smallest-set-of-smallest-rings-sssr-considered-harmful

 
Image credit: CPOA

Paper on Reaction Fingerprints now out

Congrats to our collaborators Nadine and Greg at Novartis who have just published a paper on using reaction fingerprints to classify and measure similarity of reactions:

Development of a Novel Fingerprint for Chemical Reactions and Its Application to Large-Scale Reaction Classification and Similarity
Nadine Schneider, Daniel M. Lowe, Roger A. Sayle, and Gregory A. Landrum
J. Chem. Inf. Model 2015, 55, 39

Two of the names on the author list are our very own Daniel and Roger, who provided the initial dataset used as a basis for training the reaction fingerprints, and developed the NameRxn software which names and classifies reactions according the RSC’s Reaction Name Ontology.

I think this paper is the first to cite a blog post from this blog, and so of course it deserves a special mention…:-)

And just a note on the reaction below which is taken from Figure 4 in the paper; this is now classified more specifically as an Iodo N-methylation by NameRxn rather than an Iodo N-alkylation:
Figure4
…and rumours of Roger’s move to Novartis have been greatly exaggerated. 🙂

Looking for leads in a 2D activity matrix

There is a nice dataset in the supporting information for Pickett et al. that illustrates how the sort order of rows and columns in an activity heatmap can hinder/help the identification of gaps which should be filled.

First of all, here is the heatmap in question, a 50×50 array. It show activity values for a series of analogs with the same scaffold but 50 different R groups at R1 and R2. Black squares are gaps where activity information isn’t available, white squares indicate inactive molecules, while the remaining colours indicate levels of activity from highly active (green) to lowly active (red).bitmap
The heatmap is depicted as shown in Figure 3 (top) in the paper where the rows (and separately the columns) are sorted by the most active molecule in the row. This has the effect of clustering the green squares in the bottom left of the array, and would suggest that the molecules in grid positions (2, 1) and (4, 1) should be tested next.

However, I would suggest trying (11, 2) and (20, 2) instead, and would say that in particular the molecule corresponding to (4, 1) is very unlikely to be worthwhile pursuing.

How so? Well, each row (and separately each column) can be considered a matched series; that is, the entire molecule is unchanged apart from a single R group. With this in mind, the sort order of the 2D array should be based on properties of these series rather than of any individual molecules in them, and especially not the extreme value which is unlikely to be representative of the row/column as a whole, and may indeed be a fluctuation due to experimental error.

A simple way to do this is to choose that row (and separately that column) with the largest number of filled boxes, and measure the average relative shift (that is, get the average deviation) of each row to it. If the sort order is based on this shift, the following heatmap is obtained:bitmap2This image has a much clearer band structure. The two gaps at (2, 2) and (5, 2) are much better candidates than those inferred from the original heatmap. In particular, the gap at (4, 1) in the original is now at (44, 3) and can be seen, in context, to be a poor choice despite the green box in the same column.

If you are interested in more information on tools for SAR transfer, get in touch…

R or S? Let’s vote

requiresRuleTwoForTwoLigands
CC[C@](CO)([H])[14CH2]C
The CIP (Cahn-Ingold-Prelog) priority rules are used to assign R and S labels to stereocentres. However it is known to be very prone to mis-implementation:
The CIP System Again:? Respecting Hierarchies Is Always a Must

Through our work on OEChem, OPSIN and Centres we have independently written 3 different CIP implementations and hence discussion of the corner cases of CIP inevitable becomes a heated coffee time discussion.

This deceptively simple case on the right turns out to give different results in many implementations.

Which “ligand” do you think has highest priority?

If you said [CH2][OH] you’d be right, but the majority of implementations disagree:

Toolkit/application Assignment
Marvin 2014.11.3.0 S
ChemBioDraw 12 S
RDKit (HEAD) S
Centres (HEAD) R
CACTVS (Web Sketcher) R [updated 23/02/2015]
DataWarrior (latest) S
AccelrysDraw 4.2 S (now R in BIOVIA Draw 2017)
OEChem 2014.Oct.2 S
ChemDoodle 7.0.2 S
OPSIN 1.6 R
CDK 1.5.10 S

We can speculate that the cause of the disagreement may be that the left and right side of the molecule are symmetrical by atomic number (rule 1) and that hence rule 2 (atomic mass) is then being erroneously applied to ALL ligands… while correct implementations will only apply rule 2 to split the tie between the two ligands that could not be determined by rule 1 (*). Hence this case should be assigned R.

* “precedence (priority) of an atom in a group established by a rule
does not change on application of a subsequent rule.” (IUPAC recommendations)

Coming soon: Matsy in StarDrop

For the last few months, we have been working together with Optibrium to integrate Matsy into their StarDrop platform for lead optimisation, the result of which will be released later this year:
StarDrop_Logo_300

Optibrium™ and NextMove Software, developers of software and chemoinformatics solutions for drug discovery, today announced an agreement to collaborate on the integration of NextMove Software’s Matsy technology with Optibrium’s StarDrop software suite. This combination will help to guide scientists’ optimisation strategies to quickly identify compounds with a high chance of success for their drug discovery projects.

The Matsy algorithm has been developed by NextMove Software to generate and search databases of matched molecular series to identify chemical substitutions that are most likely to improve target activity (J. Med. Chem., 2014, 57(6), pp 2704–2713). This goes beyond conventional ‘matched molecular pair analysis’ by using data from longer series of matched compounds (and not just pairs) to make more relevant predictions for a particular chemical series of interest. As part of the collaboration with Optibrium, Matsy will be applied in StarDrop’s Nova™ module, which automatically generates new compound structures to stimulate the search for optimisation strategies related to initial hit or lead compounds. StarDrop’s unique capabilities for multi-parameter optimisation and predictive modelling will enable efficient prioritisation of the resulting ideas to identify high quality compounds with the best chance of success.

For further information, see the full press release.

Introducing new formats for handling macromolecules: SMILES and InChI

SMILES and InChI are two line formats widely-used for handling small molecules, but how well do they perform for macromolecules? As a starting point, we present the hypothesis that such molecules “are too large and ungainly to represent atom-by-atom”. Let’s test this hypothesis!

So, can we generate canonical representations of macromolecules using the existing widely-used line notations SMILES and InChI, or do we need to come up with a whole new ‘standard’? Our dataset is the SwissProt database of protein structures, excluding those with ambiguous residues (X, B, Z, or J); in short, a total of 452737 proteins.

For the conversion to InChI, we can use Open Babel. Since InChI has (by design) a limit of 1024 input atoms, we modified the code to extend this limit as far as we easily could and were able to extend it to handle up structures of up to 32766 atoms (99.4% of cases). For the conversion to canonical SMILES, we used our own Sugar & Splice.

In the following plots, the green dots indicate canonical SMILES while the blue dots indicate InChI. First, a scatterplot of the timings, followed by a zoomed-in view. The point in the top right is the largest protein in the database, TITIN_MOUSE, with 35213 amino acids and 312675 atoms, and which took 334s to generate a canonical SMILES string (of length 654K). The longest sequence handled by the modified InChI code was UTP10_KLULA, with 1774 amino acids and 28509 atoms, and which took 73.2s to generate an InChI (of length 117K).timings_firsttwo_arrow
The following graphs show a different view of the results, and indicate that the majority of the proteins are handled quickly: 96% within 10s for the InChI and 99% within 0.2s for the SMILES.
timings_secondtwo_arrowWhat does this mean for the use of SMILES and InChI for macromolecules? Well, I think it shows that performance is not a problem, if that is what is meant by “ungainly” in the original hypothesis. That’s not to say that all aspects of handling macromolecules are supported by SMILES or InChIs. For example, the presence of ambiguity and variable attachements or variable composition are out-of-scope (although ChemAxon’s extended SMILES syntax may be able to handle some of these). But the size of these molecules is not in itself a problem (though InChI performance could still be improved).

The above is taken from a talk that Roger gave at the recent InChI for Large Molecule Meeting, hosted by the NCBI:

A novel procedure towards accurate estimation of room temperature utilising the patent literature

When chemists report that a reaction took place at room temperature, what exactly do they mean? Clearly the best way to approach this problem is to textmine reaction conditions from all US patent applications since 2001 and thus infer room temperature.

As previously discussed, Daniel has extracted reactions from US patents. The textmining software that Daniel has been working on, LeadMine, now has the ability to extract reaction conditions. Considering just those reactions where the temperature is explicitly given (as opposed to specified as “room temperature” or some such), the following graph is obtained (this is interactive – use the toolbar to zoom/pan; data included for the interval -273 to 800 °C):

You will immediately notice a preference among chemists for temperatures that are multiples of 5, and in particular, multiples of 10. In our determination of likely room temperature, such values are probably not useful. Once we remove them, the remaining data is as follows:

If you zoom in around the 20-25 degree area, we can infer that room temperature is 23°C or thereabouts – QED. Other peaks in the plot indicate particular reaction conditions that are common in organic chemistry: for example, both 78°C and -78°C are favourites (remember why?).

This analysis of temperature data was based on data presented by Daniel at the Fall ACS in San Francisco. His talk, “Chemistry and reactions from non-US patents”, covered:

  • Coverage of European vs United States patents
  • For novel compounds, which patent authority published first and how long was the lag
  • Trends in gene/protein mentions over time
  • Melting/boiling point extraction
  • Analysis of text mined reactions (yields vs scale, grouping them into synthetic routes, trends in solvent usage)


Finding the signal in activity data

There is a 2008 paper by the folks at Abbott that Roger refers to as “the paper that killed matched pairs for activity data”. This is the Hajduk and Sauer paper which looked at matched pair transformations across 84K compounds and 30 protein targets, and found that the potency changes associated with most matched pairs transformations were (nearly) normally distributed around zero.

I don’t have access to the Abbvie data, but I can do a similar analysis with ChEMBL data. For those assays in ChEMBL which have pIC50 data for ethyl, propyl and butyl as substituents at the same location in three molecules, here is a histogram of the pIC50 for the ethyl analog minus that of the butyl.butyl_all
The resulting histogram is pretty much in agreement with what Hajduk found: changing a butyl to an ethyl is equally likely to increase activity as decrease it. If we think about it, it’s fairly obvious why this might be – we are pooling data from different binding environments in different proteins, and the effect of the change depends on the binding environment.

So matched pairs are dead for activity. Or we have to restrict the analysis to data just for a particular pocket in a particular protein.

But what if we consider additional activity data? What if we already know the relative activities of propyl and butyl, for example. Let’s say that we know in a particular case that the propyl analog has a greater pIC50 than butyl, and then plot the ΔpIC50 for ethyl minus butyl:
butyl_0
…or vice versa, where propyl has a smaller pIC50 than butyl:
butyl_1
Interesting, eh? The point is that knowing some activity information improves our predictive ability. If we know that propyl > butyl, then it increases the chance that changing butyl to ethyl will increase the activity.

The question then arises, how best to extract and apply this information? One approach would be to throw more matched pairs at the problem. But actually, a simpler and more elegant approach is to look beyond matched pairs to the general concept of matched series.

Here are the slides I presented on “Evidence-based medicinal chemistry with matched series” at the recent UK-QSAR meeting in Cambridge.